
You've built an amazing AI chat or voice agent. It works in testing, customers love the demo, but how do you know it's performing well in production?
Traditional monitoring tools track uptime, latency, and error rates. They tell you if your system is running, but not if your agent is actually doing its job. Your agent could be technically “working” while completely failing at its purpose: going off-script, hallucinating facts, or frustrating users.
The problem gets worse at scale. How do you monitor 1,000+ calls per day? You can't listen to them all.
Without proper monitoring, issues compound silently:
- A small change introduces hallucinations. Customer complaints spike before your team realizes what changed.
- Inefficient prompts triple token usage, leading to a surprise $10K bill.
- Repeated poor experiences drive customers away.
These failures rarely trigger system alerts, but they directly impact customers and cost.
This is where Cekura comes in: purpose-built monitoring for conversational AI agents.
What Effective Conversational Agent Monitoring Looks Like
1. Conversation Quality & Correctness
Is your agent actually doing its job?
- Hallucination detection: Is it making up information not in your knowledge base?
- Relevancy: Are responses on-topic or going into tangents?
- Response consistency: Does it contradict itself during the call?
- CSAT and sentiment: How satisfied was the customer and what emotion did they express?
2. Technical Performance & Reliability
Is your infrastructure working correctly?
- Latency: Response time per turn across the conversation.
- Tool call success: Did API calls and integrations execute properly?
- Transcription accuracy: Is speech-to-text working correctly?
- Infrastructure issues: Detect when your agent goes silent for extended periods.
3. Conversation Flow & Dynamics
Is the interaction natural?
- Interruption patterns: Who interrupts whom, and how often?
- Stop time after interruption: How long does your agent take to pause when interrupted?
- Talk ratio: Is your agent dominating the conversation or too passive?
- Unnecessary repetition: Is it stuck in loops?
- Call termination: Did either party end the call appropriately, or was it abrupt?
4. Voice Quality & Delivery (for voice agents)
Does your agent sound professional?
- Voice clarity and tone: Overall audio quality and consistency.
- Pronunciation: Are technical terms, product names, or medical terminology spoken correctly?
- Speaking pace: Words per minute; too fast is confusing, too slow feels unnatural.
- Letterwise clarity: When confirming phone numbers or emails, is it clear?
- Gibberish detection: Catch voice synthesis failures producing unintelligible speech.
5. Custom Metrics for Your Workflows
Define metrics specific to your use cases, business rules, or agent behaviors, and get alerts when they deviate.
Visual Monitoring with Dashboards
Cekura provides customizable dashboards that give teams a real-time, visual view of agent performance. With dashboards, you can:

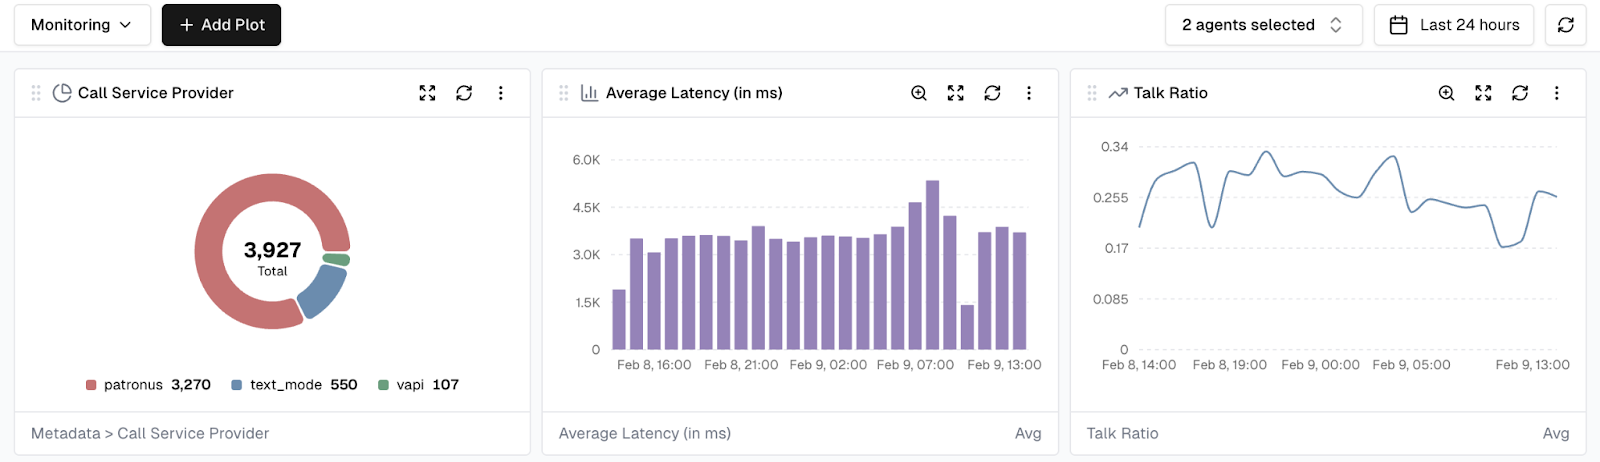
- Create custom views: Build dashboards tailored for different stakeholders such as engineering, product, or leadership.
- Track key metrics: Visualize any metric over time using line charts, bar charts, or distributions.
- Aggregate data: View metrics aggregated by hour, day, week, or month.
- Filter and segment: Focus on specific agents, time ranges, or customer segments.
- Combine visualizations: Bring multiple chart types into a single dashboard for a comprehensive view.
Dashboard data updates in real time as new conversations are processed, providing immediate visibility into how agents are performing.
Dashboards serve as the visual layer on top of Cekura’s alerting system. Teams can investigate trends when alerts fire, or proactively monitor metrics to catch issues before they escalate.
Smart Alerting: Signal vs Noise
Most monitoring tools generate too many alerts. Teams start ignoring them, and real issues get missed.
Simple threshold alerts do not work for conversational agents. For example, “latency > 2 seconds” does not account for natural variation. Complex queries legitimately take longer.
Cekura’s Statistical Intelligence
Instead of arbitrary thresholds, Cekura learns what is normal for your agent over time:
- Adaptive baselines: Understand normal behavior across conversations.
- Directional alerts: Notify only when metrics shift meaningfully from historical patterns.
- Anomaly detection: Real-time alerts for critical deviations.
Example: Context Makes the Difference
- Traditional monitoring: “Latency exceeded 2s on 50 calls today.”
- Cekura: “Average latency increased 40% over the last 100 calls (1.2s to 1.7s), exceeding 2σ from historical variance. This began 2 hours ago.”
The difference is context that tells you this is actually worth investigating.
Multi-Channel Delivery
Different stakeholders need alerts delivered differently:
- Critical issues: Immediate Slack notifications with rich context and charts.
- Daily or weekly summaries: Email reports for stakeholders.
- Custom routing: Configure rules per team, role, or severity.
- Webhooks: Integrate with PagerDuty, Opsgenie, or your incident management system.
Want to Learn More?
Conversational agents require more than basic uptime checks. If you are running chat or voice agents at scale, monitoring quality and behavior is not optional.
Start a free trial: https://dashboard.cekura.ai/dashboard
Book a demo: https://www.cekura.ai/expert